

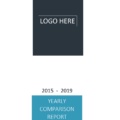
Yearly Comparison Report Template
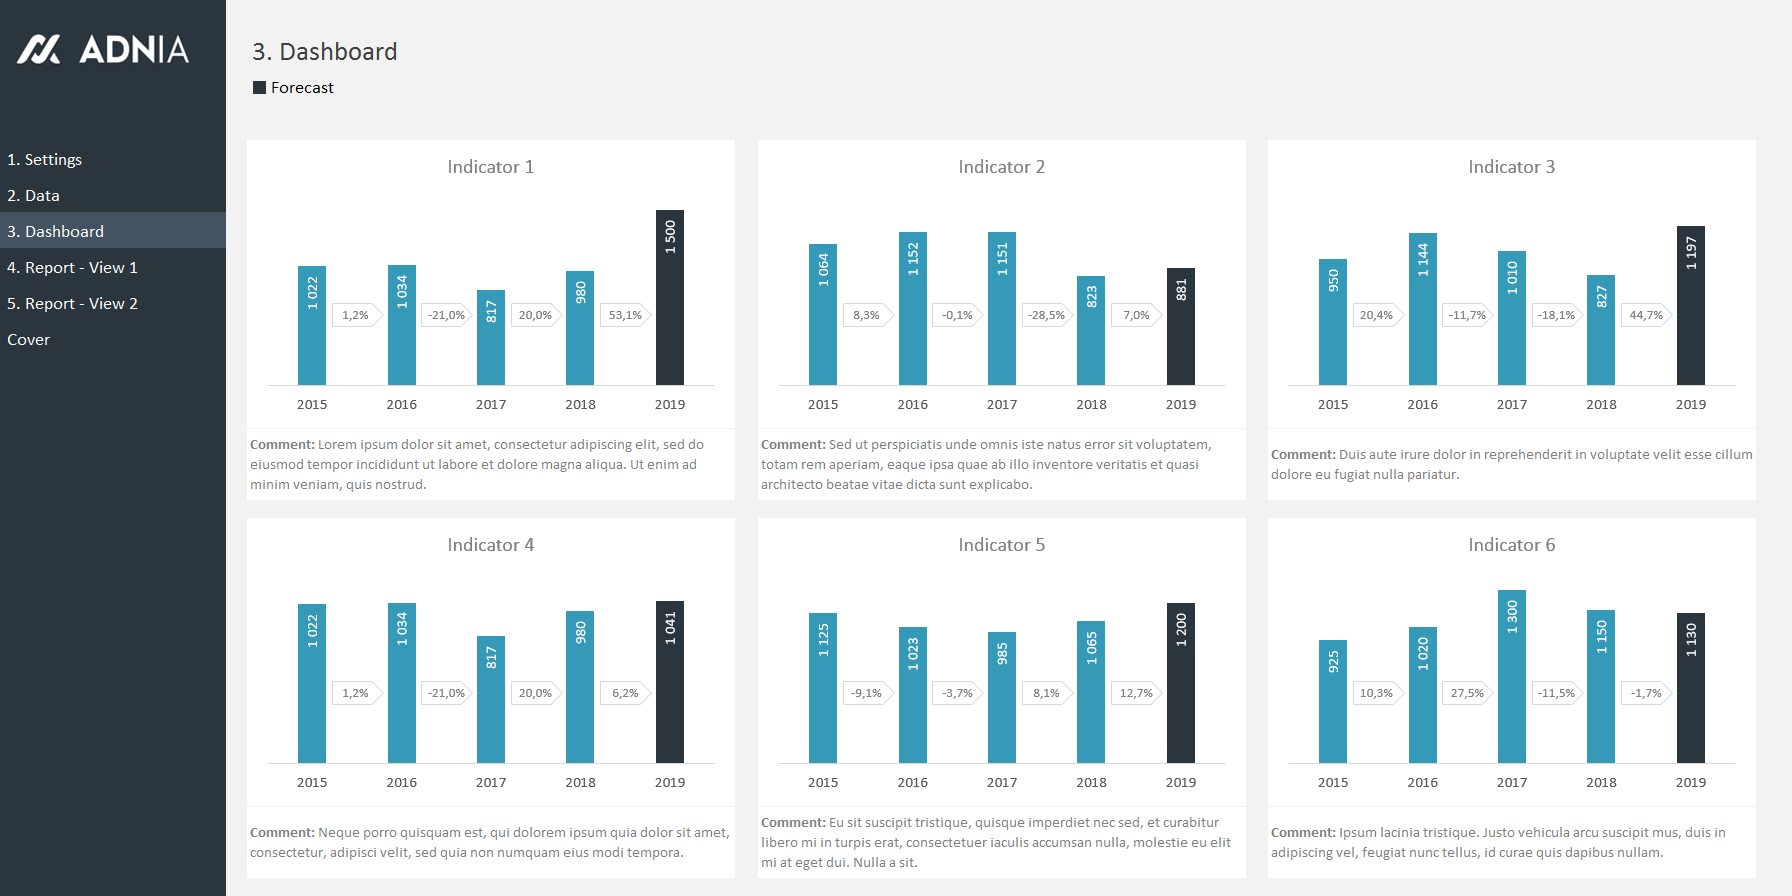
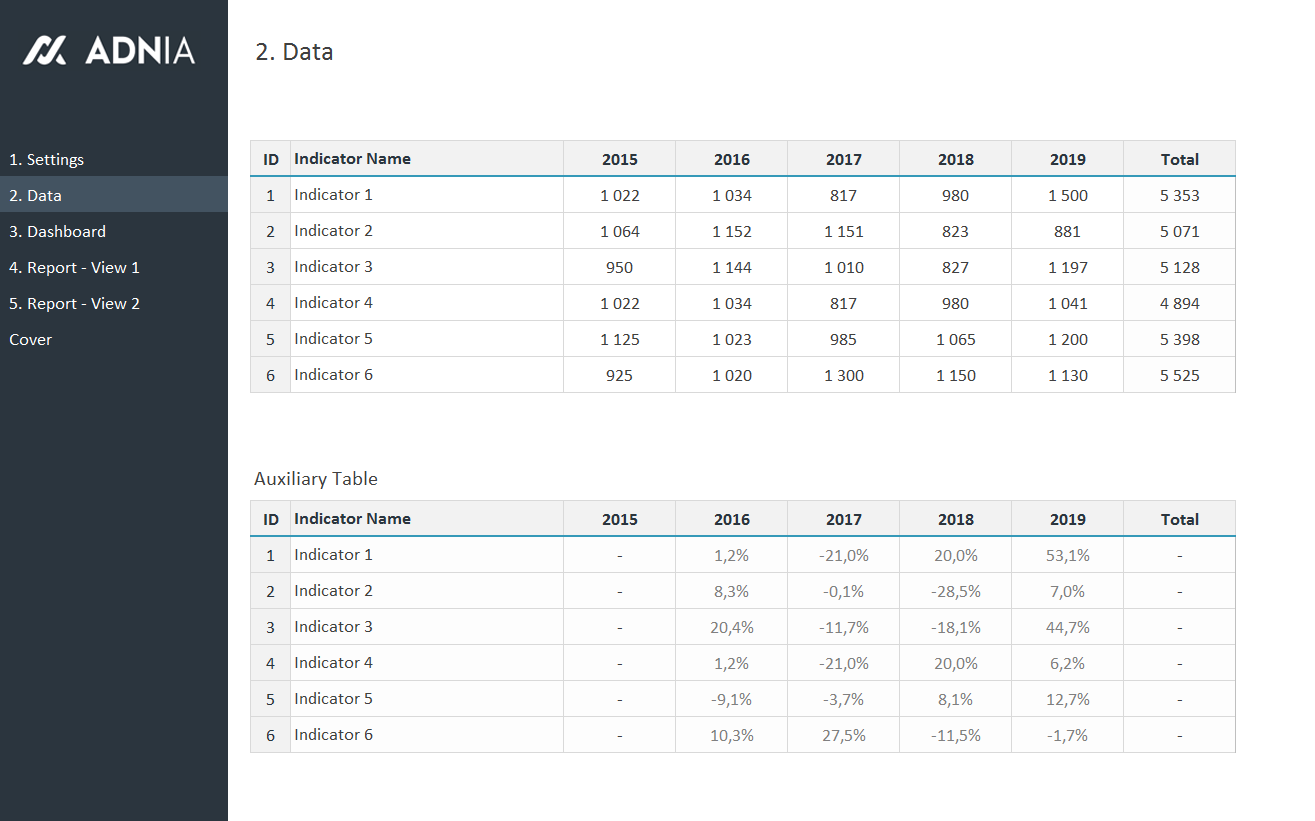
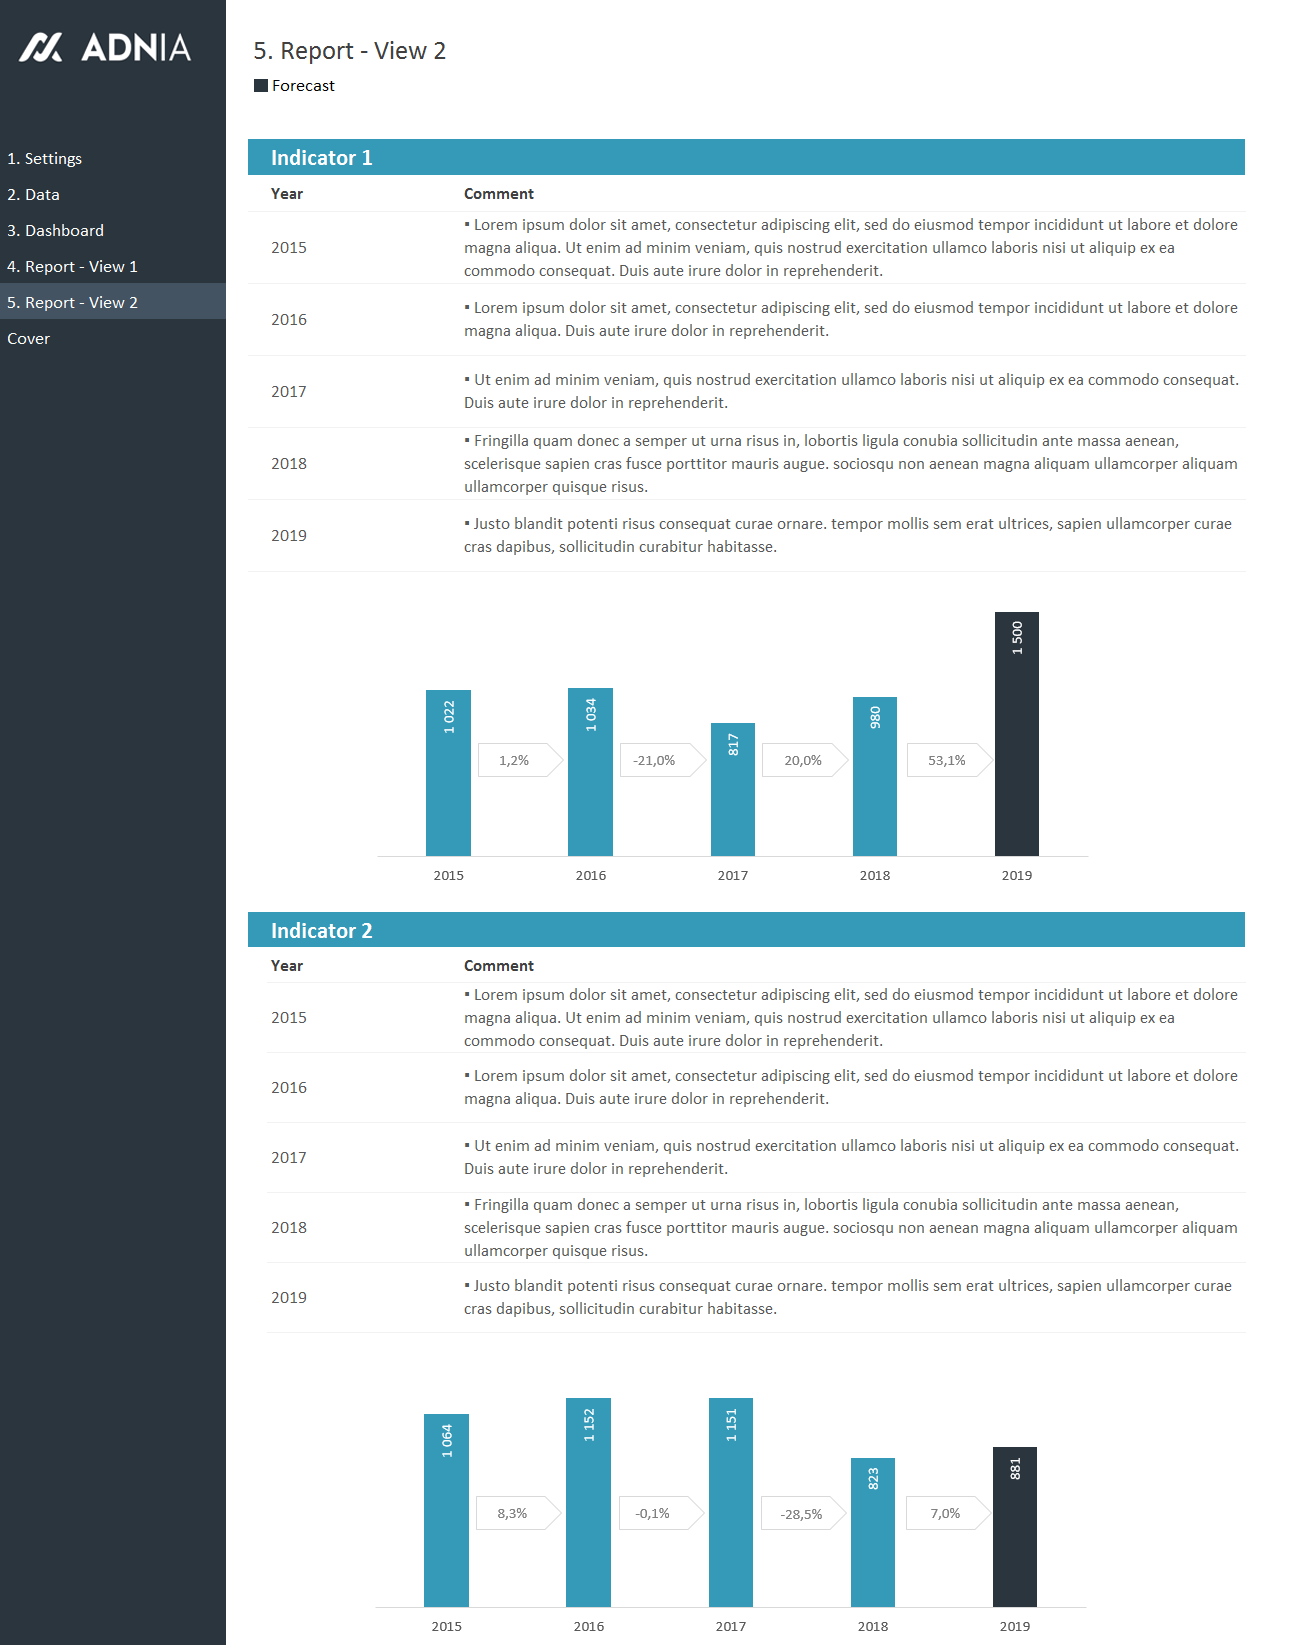
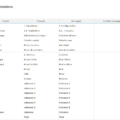
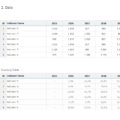
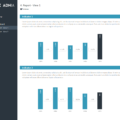
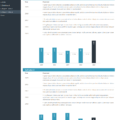
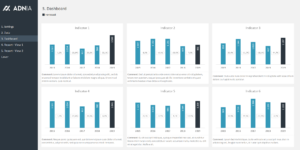
This Excel reporting tool is designed for you to compare key performance indicators over a 5-year period, including a forecast year. The KPI Report Excel template gives two options for reports to visualize the data. Additionally, you can write comments in each of the graphs for better communication with your colleagues.
Key Features
- Beautiful charts to display historical performance indicators
- Easily compare KPIs over a 5-year period, including a forecast year
- One dashboard and two different report layouts available
- A beautiful report cover to impress your boss and clients
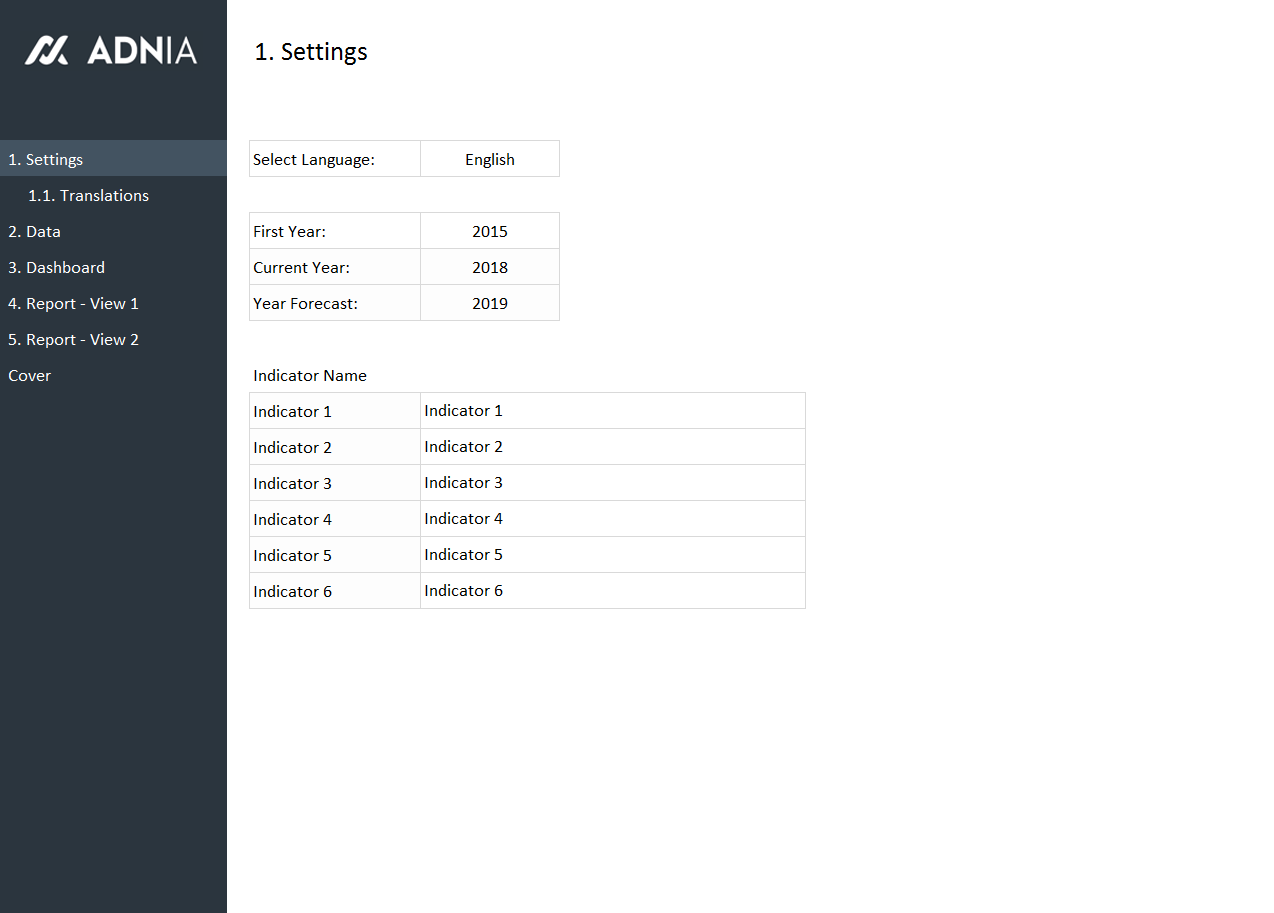
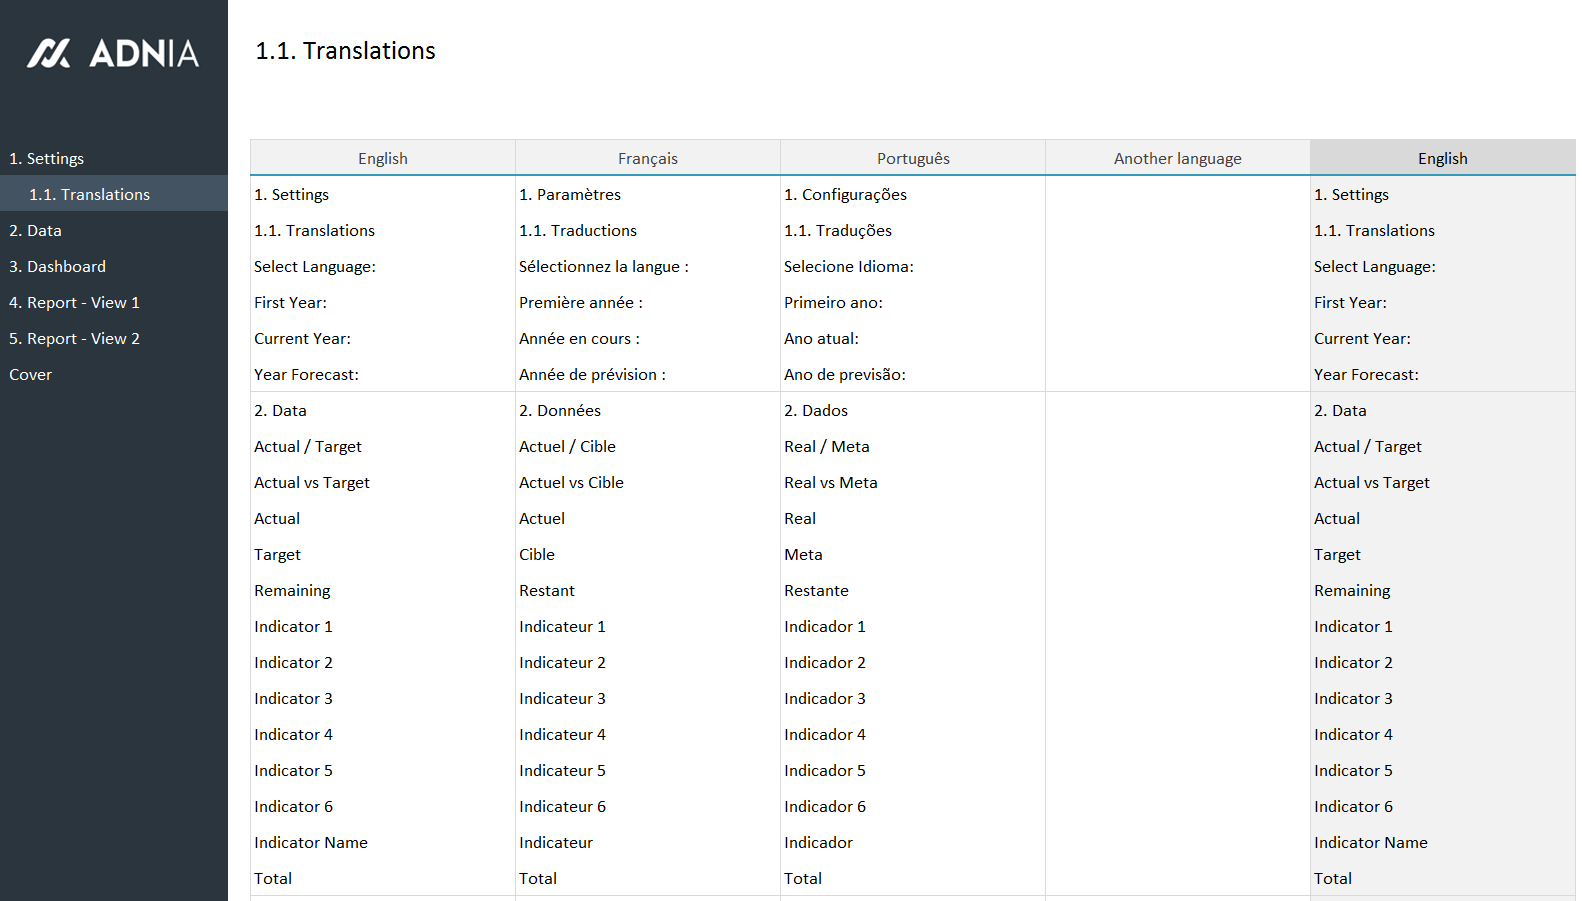
- Multilingual template: Select one of the available languages (English, French, or Portuguese) or manually translate to the language of your choice
Simple and Professional
- Fully unlocked template
- Spreadsheets ready for printing without Adnia logo
- No monthly fees
- Immediate download
- Secure payment with PayPal (no PayPal account needed)
What is included?
- One template with sample data
- One template ready to receive your data

Demo - Strategic Plan Template Excel 1.01 MB 14 downloads
See more details about the Strategic Plan Template Excel: https://adniatemplates.com/product/strategic-plan-template-excel-2026-edition/ ...- Estimated Delivery : Up to 4 business days
- Free Shipping & Returns : On all orders over $200
How it works:
Other Information
- Built for Excel 2010 or later
- Licensed for Private Use Only (not for distribution or resale)
- The template may NOT be sold, distributed, published to an online gallery, hosted on a website, or placed on any server in a way that makes it available to the general public.
Help & Support
4 reviews for Yearly Comparison Report Template
5.00 out of 5 stars
Add a review
Related products
-
-
-
Adnia Excel Dashboard Template
Original price was: $25.$23.50Current price is: $23.50. -
Work Plan Template
Original price was: $50.$39Current price is: $39. -
Joanne Richards –
Being able to look back over several years in one report has been really useful. It gives a much better picture than comparing separate files
Laura Peterson –
I like being able to compare several years of results on one report. It makes it much easier to spot long-term trends before planning for the next year.
Genevieve Kingsford –
Comparing several years of performance is much easier now. I can see historical results alongside the forecast, and the report layouts make it simple to present the numbers clearly during reviews.
Lucien Sterling –
This yearly comparison report makes it much easier to see how our main KPIs have changed over time. Viewing five years together provides more useful context than comparing only the current year with the previous one.