

Excel Dashboard Templates Speedometer
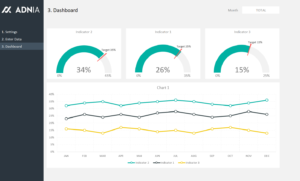
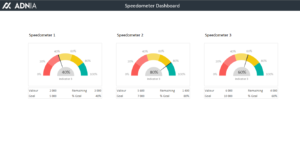
This Excel Dashboard Templates Speedometer displays up to three indicators in speedometer format. You can use this speedometer chart on other dashboards or even learn how to create a speedometer gauge using a pie chart and a donut graph together. It’s a great way to rev up your professional communications!
Key Features
- Beautiful speedometers to display performance indicators
- Easily build your own visual boards using our professional charts
- Communicate to everyone what performance measures are in place and celebrate accomplishments
- Use these speedometers on other dashboards
- Learn how to create an Excel speedometer chart
Simple and Professional
- Fully unlocked template
- Spreadsheets ready for printing without Adnia logo
- No monthly fees
- Immediate download
- Secure payment with PayPal (no PayPal account needed)
What is included?
- One template with sample data. You can enter your own data manually.
See Also:
- Estimated Delivery : Up to 4 business days
- Free Shipping & Returns : On all orders over $200
How it works:
Other Information
- Built for Excel 2010 or later
- Licensed for Private Use Only (not for distribution or resale)
The template may NOT be sold, distributed, published to an online gallery, hosted on a website, or placed on any server in a way that makes it available to the general public.
Help & Support
3 reviews for Excel Dashboard Templates Speedometer
5.00 out of 5 stars
Add a review
Related products
-
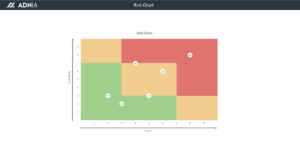
Risk Assessment Chart Template
Original price was: $25.$22Current price is: $22. -
Annual Report Template Excel
Original price was: $35.$29.40Current price is: $29.40. -
Dashboard Layout Template Package
Original price was: $75.$45Current price is: $45. -
-
Dashboard Design Layout Template 3
Original price was: $25.$22Current price is: $22.
Meera Nambisan –
The speedometer-style charts make KPI updates much easier for people who don’t want to read through rows of numbers. I used them in a performance report, and the results were immediately clearer during the meeting.
Jennifer Collins –
I bought this after getting tired of updating my old spreadsheet every month. This has been much easier to keep up with.
Melissa Turner –
I wanted a better way to show KPI performance without filling reports with charts. These speedometers made the dashboard much easier to read